Running Spectre
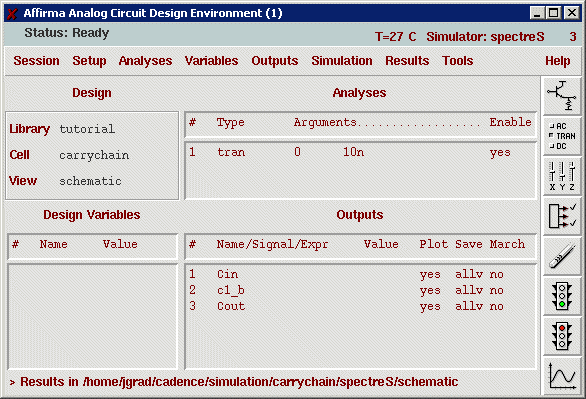
Selecting outputs

Starting Spectre
This simulation is not very complex and should complete in a couple of seconds. The waveform window pops up as soon as the simulation is finished:

To take first simple measurements, hit "a" to activate marker A and place it for instance in the midpoint of a transition. To measure the delay to another transition, hit "b" to get the second marker. After placing both markers, the time difference is displayed at the bottom of the window.
To zoom into an area of interest, drag a box around the area with the right mouse button. To return to full view, hit "f".
To split the plot up into individual axes, select "Axes | To split".
Notes on using Spectre
-
Normally, all node voltages of the circuit are saved during simulation. This means, you can always delete outputs in Analog Artist and select different outputs to be plotted without having to rerun the simulation again. Just hit the "Plot" icon
 to update the waveform window.
- Simulations tend to grow large fairly quick and you want to make sure that you don't exceed your quota. For big simulations, you may want to save only the nets of interest by deselecting this feature under "Outputs | Save all..." in Analog Artist.
- Once you exit Analog Artist, the simulation results will not be deleted. In most cases you will not need to keep those. This directory is the one you selected with "Setup | Simulator/Directory/Hosts...".
- Before exiting Analog Artist, be sure to save your current state with "File | Save State...". This will save all the setup information you entered and next time you can simply load this state and you are ready to go.
- When you start a new cell and want to reuse for example the stimulus information of a cell you already did, you can just load the state of that cell for the new cell.
- You can save different setups under different names, which gives even more flexibility.
- All the states are saved in the directory "~/.artist_states" so deleting your simulation directory will not affect your saved states.