Simulation With Verilog-XL
Setting up Verilog-XL to Integrate within Cadence Design Tools
Make sure all Verilog files you use, following the procedure in this section. You need to prepend the following lines to it:`resetall
`celldefine
`delay_mode_path
`timescale 1ns/10ps
Then append the following to the same functional view:
`endcelldefine
Compiling and Simulating your Verilog File
Compile your Verilog file using the command:
verilog file.v
If you have multiple files that are related, you need to compile them as follows:
verilog file1.v file2.v
If you get any error messages, fix the errors and try again. If you are ready to test your part, then compile your verilog file and your test bench together using the command:
verilog file.v file_test.v
Many people prefer a GUI representation of the signals in their design. Next, start the GUI simulator using the command:
signalscan
A window should appear like the following:
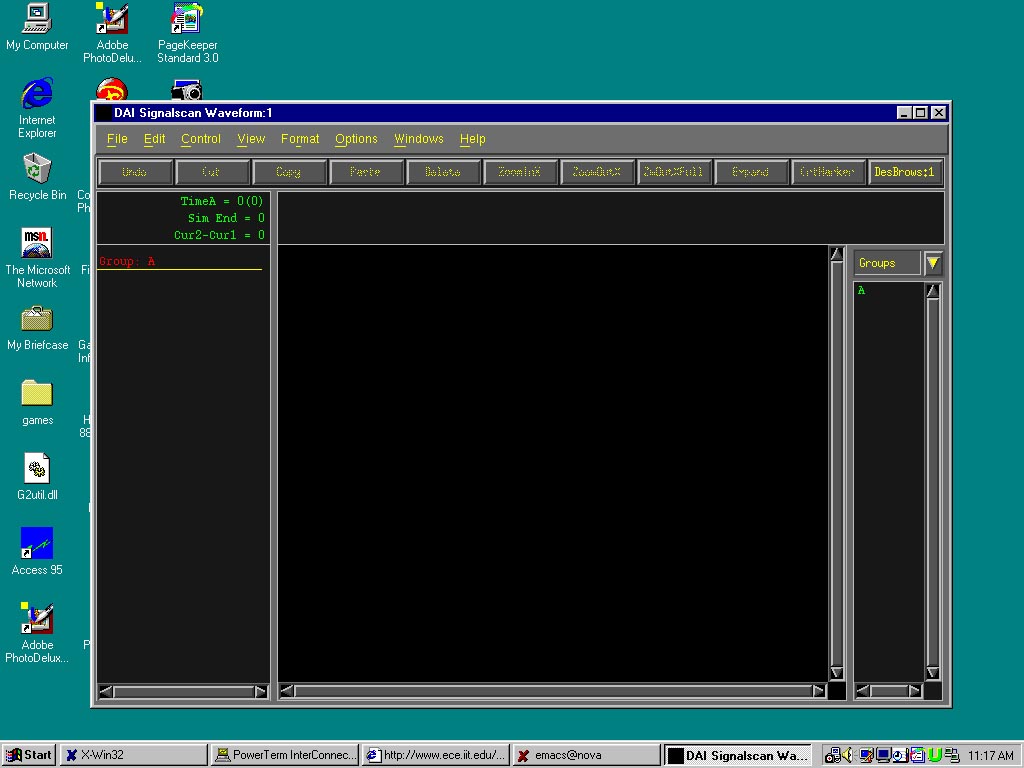
You now can load the stimulus file you created. Go to File->Open Stimulus File and find shm.db and double click on it. This should open a directory in which you can then open shm.trn. Click shm.trn and hit OK.
You can now chose the ports you wish to view. Go to Windows->Design Browser. You should see a window like the following:
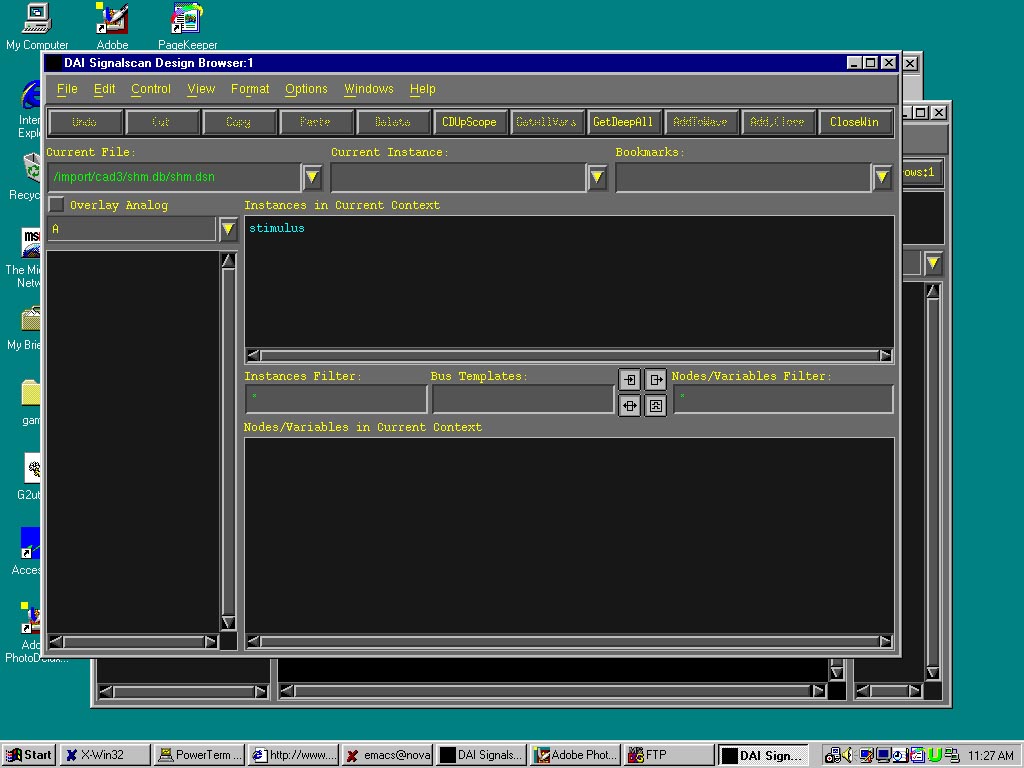
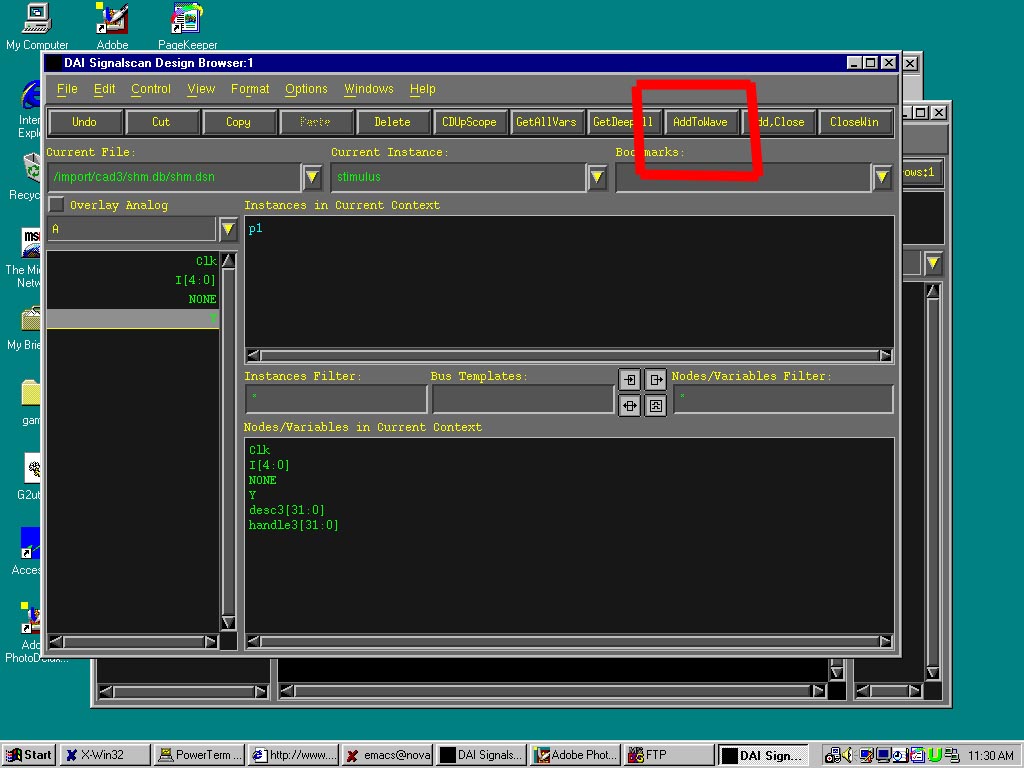
Click once the word stimulus and all the ports of your design will be visible in the lower half of the screen. Then choose each port you wish to view on your waveform. Click each signal and it will appear on the left hand side of the screen. Once you have finsihed choosing all the signals you wish to view, click AddtoWave button on the top of the screen (highlighted in red) shown in the following figure:
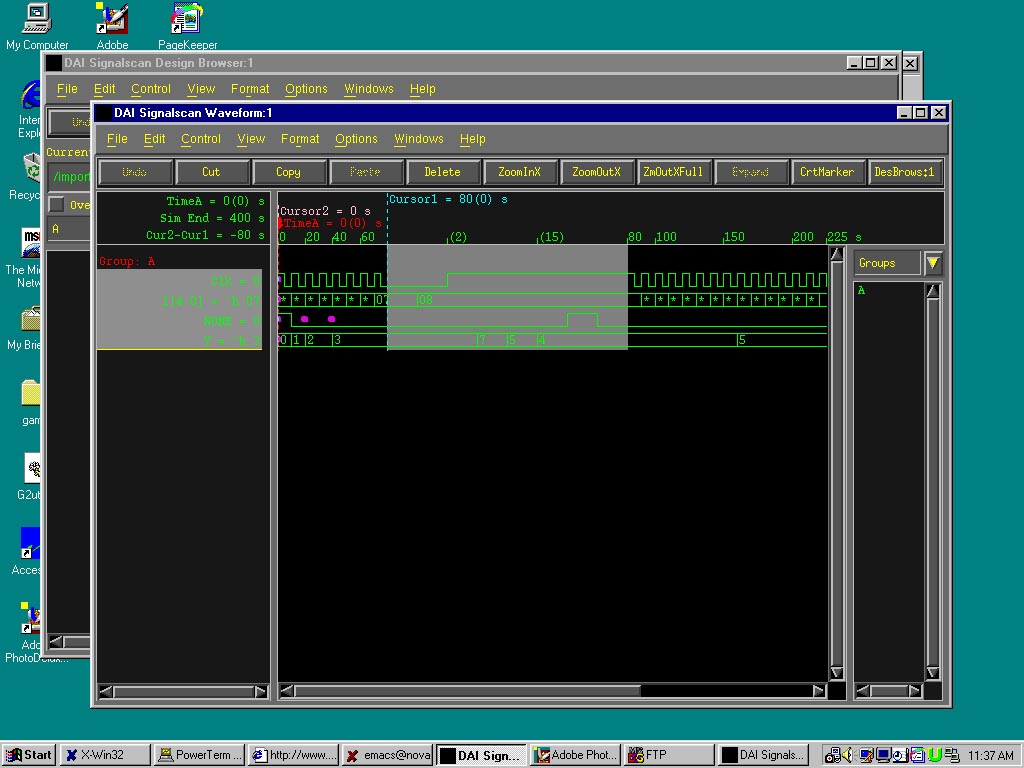
The waveform viewer will appear showing you all your signals in a fabulous GUI output as shown in the following figure:
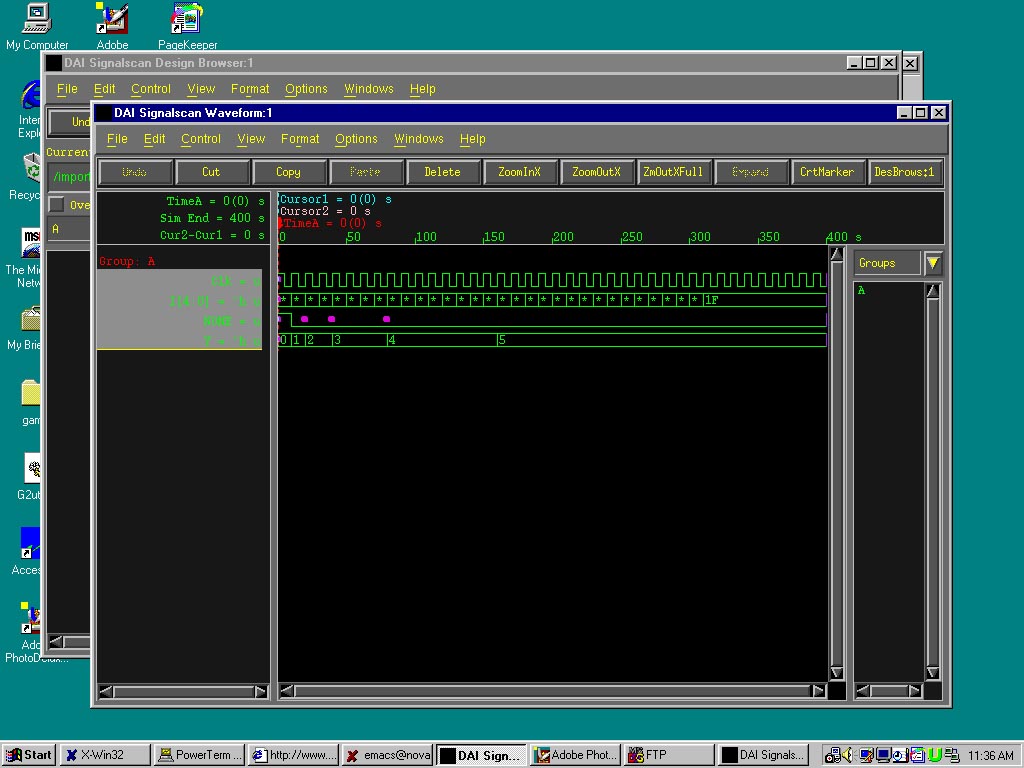
You can now print out your waveform by going to File->Print.
If you look at your waveform, you will notice something strange. Notice that there are some waveforms which show PINK dots. The PINK dots indicate a transition of more than one value. To see all the transitions at the point, click once on the PINK dot and go to the menu and click View->Expand Sequence Time->At Cursor1 and the waveform will shown all the transitions at this point as shown by the following figure:
This wavefore is actually from the logic that had some glitches. Well, these glitches are due to critical path delays caused by the "rippling" of each signal through a common block as seen by the previous expanded signal. You can now see that HDL simulation also can help you spot possible problems with your designs.